The price of Bitcoin has fallen from its highest point of US$63,523 on April 14, 2021 (Coinmarketcap data) to US$15,782 on November 12, 2022 (Coinmarketcap data). It has been declining for 577 days, which is the longest bear market in history. This time, the decline was 75.2%, the fourth largest decline in history.
Has the Bitcoin price bottomed?
I think it is very likely that $15,782 is the lowest point of this bear market. The bottom is now.
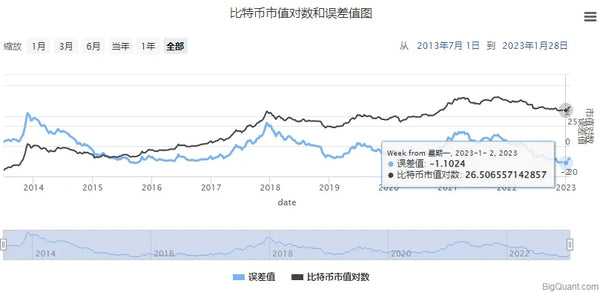
The above picture is the model I studied to predict the long-term trend of Bitcoin. From 2013-07-01 to 2023-1-28, the trend chart of the logarithm of Bitcoin market value and "error value" can be seen. When the market value of Bitcoin is at the top or bottom, the "error value" is also at the top or bottom, and fluctuates between 1- and 1.
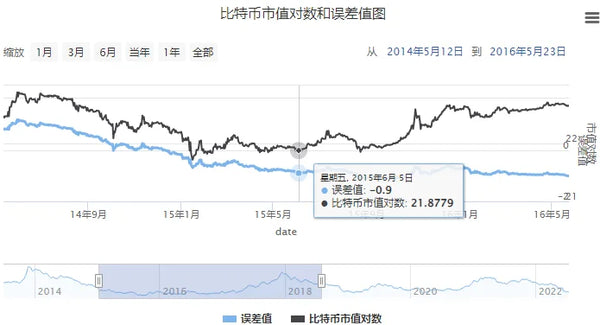
The chart below shows that when the Bitcoin price bottomed on June 5, 2015, the "error value" was -0.9.

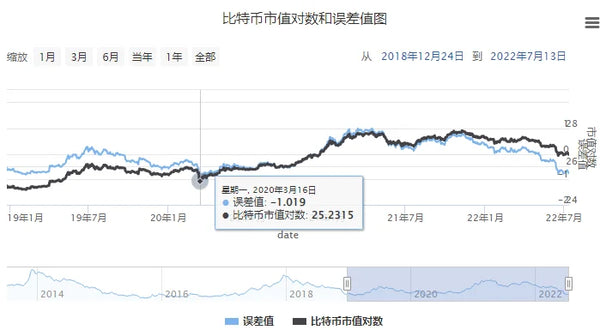
The chart below shows that at the Bitcoin price bottom on March 16, 2020, the "error value" was -1.

The chart below shows that on January 2, 2023, the "Error Value" indicator was -1.1.

So I think now is the historical bottom. I bought Bitcoin in October 2022 at about $19,000. I chose to hold it and will continue to buy it.


